This is an old revision of the document!
How to debug D3D9
Compile both Mesa-3D and Wine with CFLAGS and CXXFLAGS set to debug.
CFLAGS="-Og -ggdb -g -gdwarf-2 -gstrict-dwarf" CXXFLAGS="${CFLAGS}"
- -Og is better than -O0 and disable optimalization which interferes with debug (gcc >= 4.8)
- -ggdb, -g adds debug information to code
- -gdwarf-2, -gstrict-dwarf limit DWARF version to 2. It's necessary for both, because wine support is limited to version 2.
- you can also add -pg for profiling. Beware - may cause compilation issues.
Also configure Mesa-3D with
--enable-debug
Make sure, you have disabled striping debug symbols if you are using distribution packages, ebuild or AUR.
A problem can be located in either wine or Mesa. If it's in mesa, you'll need to use
- the NINE_DEBUG variable, to know what the D3D9 ST is doing. Pass NINE_DEBUG=help to get all options.
- the NINE_TGSI_DUMP=1 variable for dumping generated TGSI code.
- the NINE_FF_DUMP=1 variable for dumping shader generated by fixed function (ff)
- the TGSI_PRINT_SANITY=1 variable will precisely check TGSI and assert in case of errors
- the D3D_ALWAYS_SOFTWARE=1 will run it on CPU instead of GPU… extremly slow
when you comparing logs from ALWAYS_SOFTWARE, is handy to get rid of different addr for diff, with this helps you
sed -i -e “s/0x[0-f]*/0x0/g” logfile.log*
For wine, WINEDEBUG=+d3dadapter9,+d3d9 should be enough.
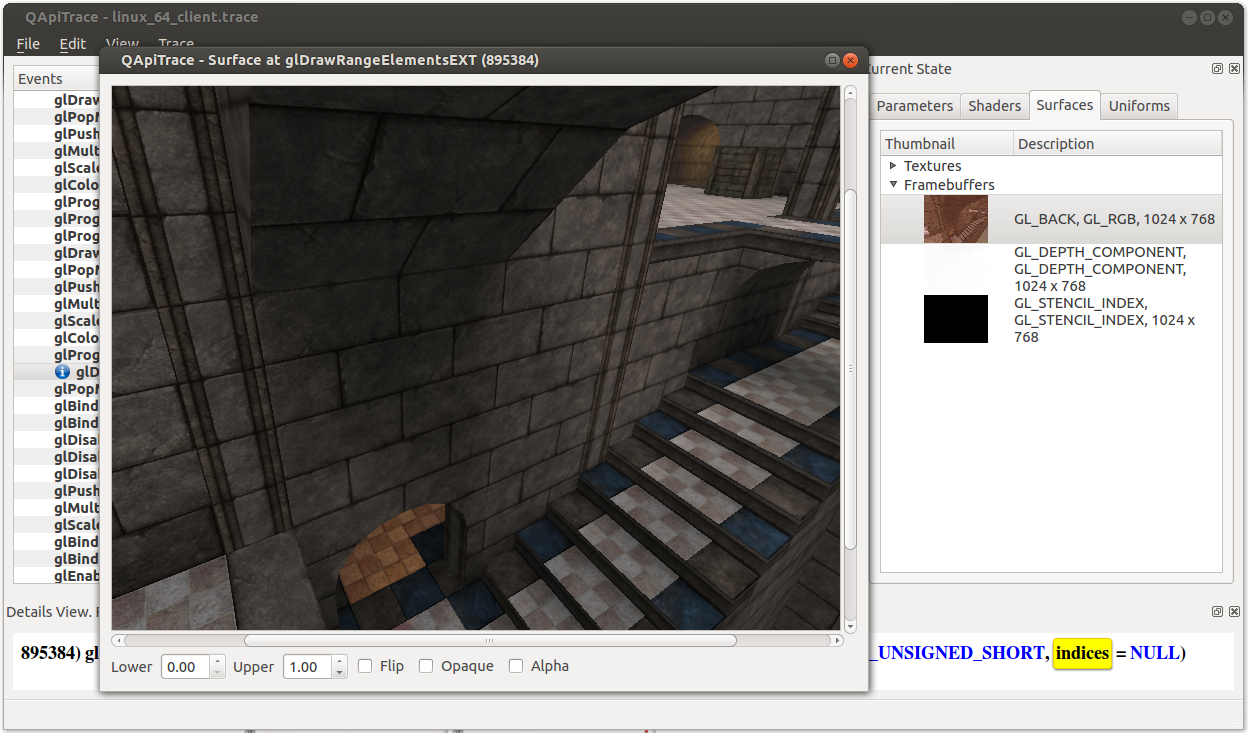
You also may be interested in apitrace.
APITrace
- For debugging Windows applications you'll need to use APITrace compiled for Windows
- The Windows version is almost always required for replaying
When uploading APITrace .trace file, please compress it with xz (best compression → xz -9e your_app.trace)
- We have dedicated server space for APITrace files, contact sarnex or okias on IRC for the information.